Sustainable Design improved by Open Data?
Recently New York City released building permit, property record, and building footprint data. New York is releasing this and other data as part of its effort to implement the 2012 Open Data law. The World Bank also recently announced a million dollar open data initiative to help developing countries get going with open data.
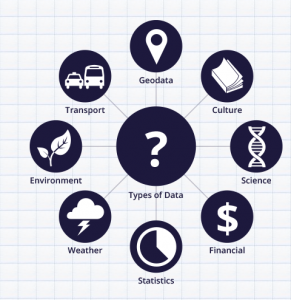
When public agencies or other organizations have open data policies, it typically means they are making available the data (non personally idenfiable) that they routinely collect. But not only are they making it available, they’re putting it out in forms that are easy to use, free or low cost, and available to everyone. The Open Knowledge Foundation suggests a range of different data types to consider for open data policies:
Open data holds the promise of improving sustainability by improving our knowledge about resource use and how to reduce it, improving citizen engagement by making information more locally relevant, and driving social innovation in a sort of crowd sourcing way. But it’s still tricky to find meaning in open data, as the term “data smog” suggests. Benjamin Bratton says,
You can’t walk through a design graduate program anywhere in the first world, whether in architecture, interaction design, or media arts, without seeing at least half a dozen beautiful “data smog” projects. (Situated Technologies Pamphlet 3)
He calls this “spectacularization of information” which he worries might further distance people by making them audiences for data rather than empowering them as manipulators or quesitoners of data.
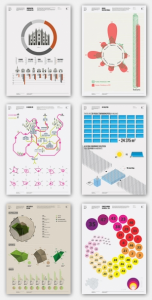
Given these concerns, as a first step in coming to terms with open data, I like this example from Milan’s design research lab, where design students are challenged to tell a story about Milan using some of the city ’s open data.
The DESIS lab at TU Eindhoven is also asking questions about open data, and how we can design an interface in a tangible device that let’s people manipulate available data.
Do you have any examples to add? Let us know in the comments.
Next Thursday we’ll move on from open data to some implications for sustainable design from “big data” and “smart data.”
[Breaking news: Tech President reports that 60 countries have joined the Open Government Partnership to, “promote transparency, empower citizens, fight corruption, and harness new technologies to strengthen governance.” Their third annual summit is at the end of October.]
________________________________
Pass this post on and subscribe to the monthly summary (with bonus article!) using that form in the upper right.
Also check out the Design, Consumerism & Activism blog on Ditching the Language of Moderation with terms like post crash city, radical mitigation and fossil dependence as the new apartheid.
See you next week.
Subscribe
About
Join me on the first Thursday of the month for ideas, tips and inspiration for teaching and researching sutainable design. Sign up to get these posts in your inbox.


